PyTinyRenderer软渲染器-01
TinyRenderer是一个从零开始用C++写一个光栅化渲染器,不依赖任何外部库,实现一个超级简化版的OpenGL。但是PyTinyRenderer相信你看名字也能知道,这是一个采用Python来实现的渲染器,当然和TinyRenderer一样,会尽量少的使用外部库。但是遇到类似TGA文件的读写,也可以使用到Pillow等库来进行操作,核心目的是了解渲染的工作流而已。
实现Image的操作库
我们需要先实现一个Image Lib,创建并保存图片,并且可以设置图片上的每一个像素。当然,效率优先的前提下直接使用pillow依赖库也是个不错的选择。
安装pillow库,这与TinyRenderer的tgaimage.cpp的作用是一样的,只不过直接生成PNG的图方便预览。
pillow==10.3.0
from PIL import Image

image = Image.new('RGB', (50, 50))

red = (255, 0, 0)
green = (0, 255, 0)

# 画两条线试试
for i in range(0, 50):
    image.putpixel((i, 25), red)
    image.putpixel((10, i), green)

image.save('output.png')
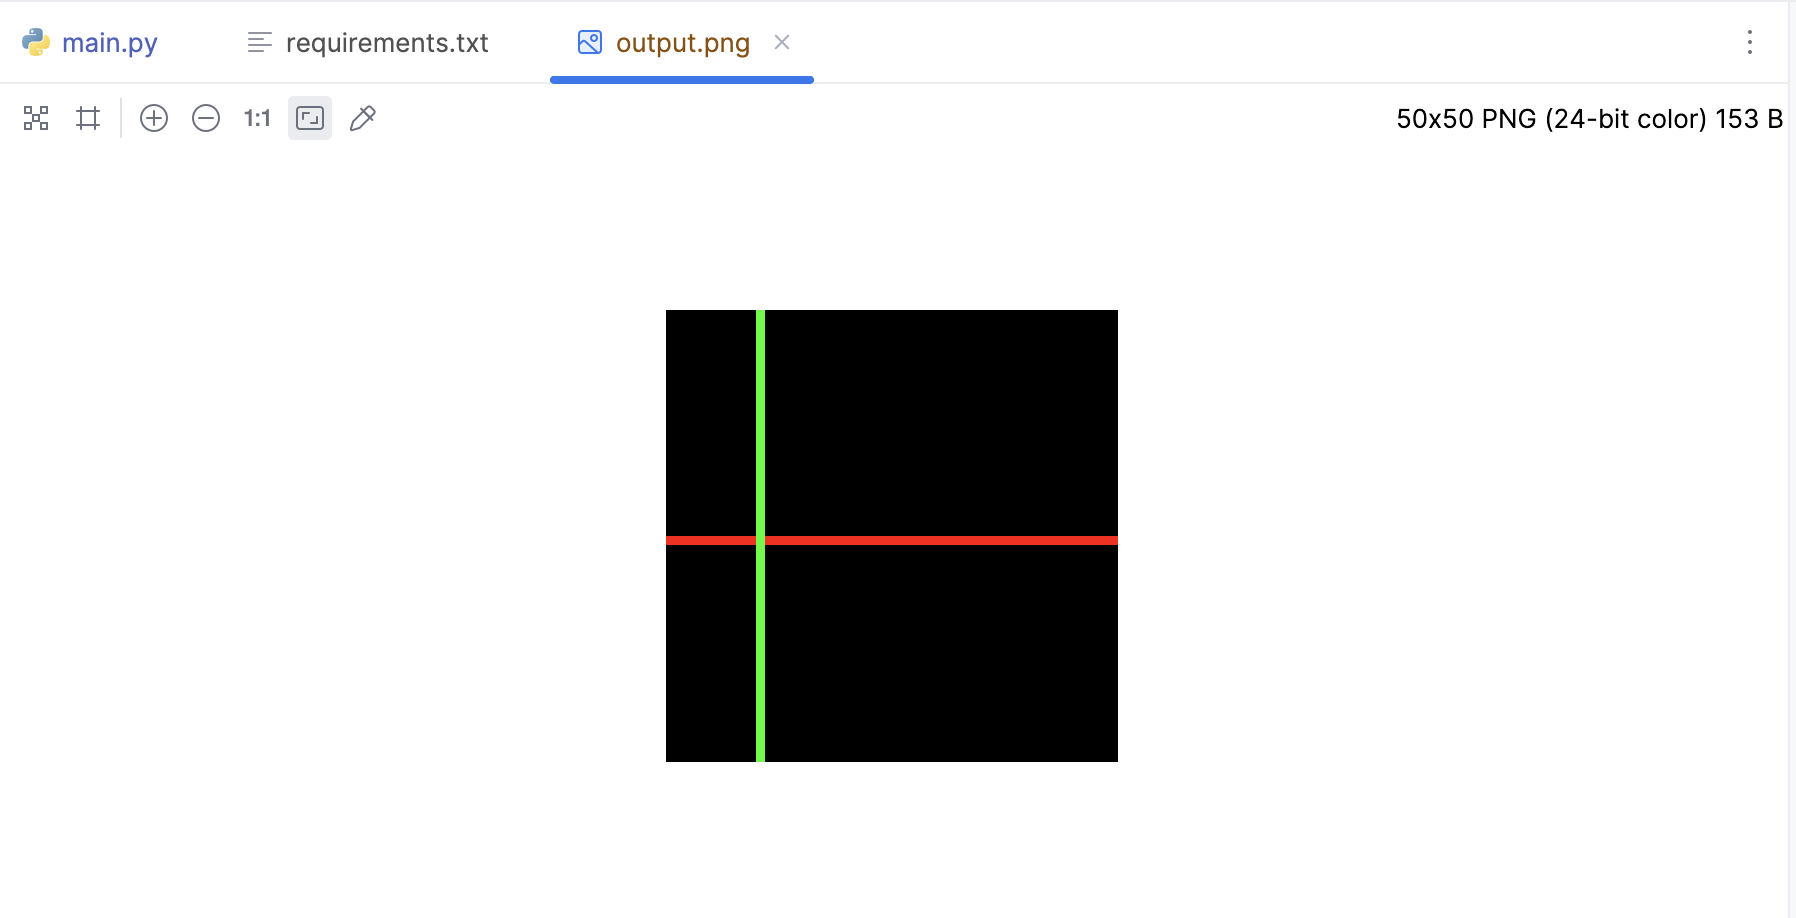
看得出来,需要用到的核心方法就是putpixel,用来设置一个像素点颜色,然后save保存即可:
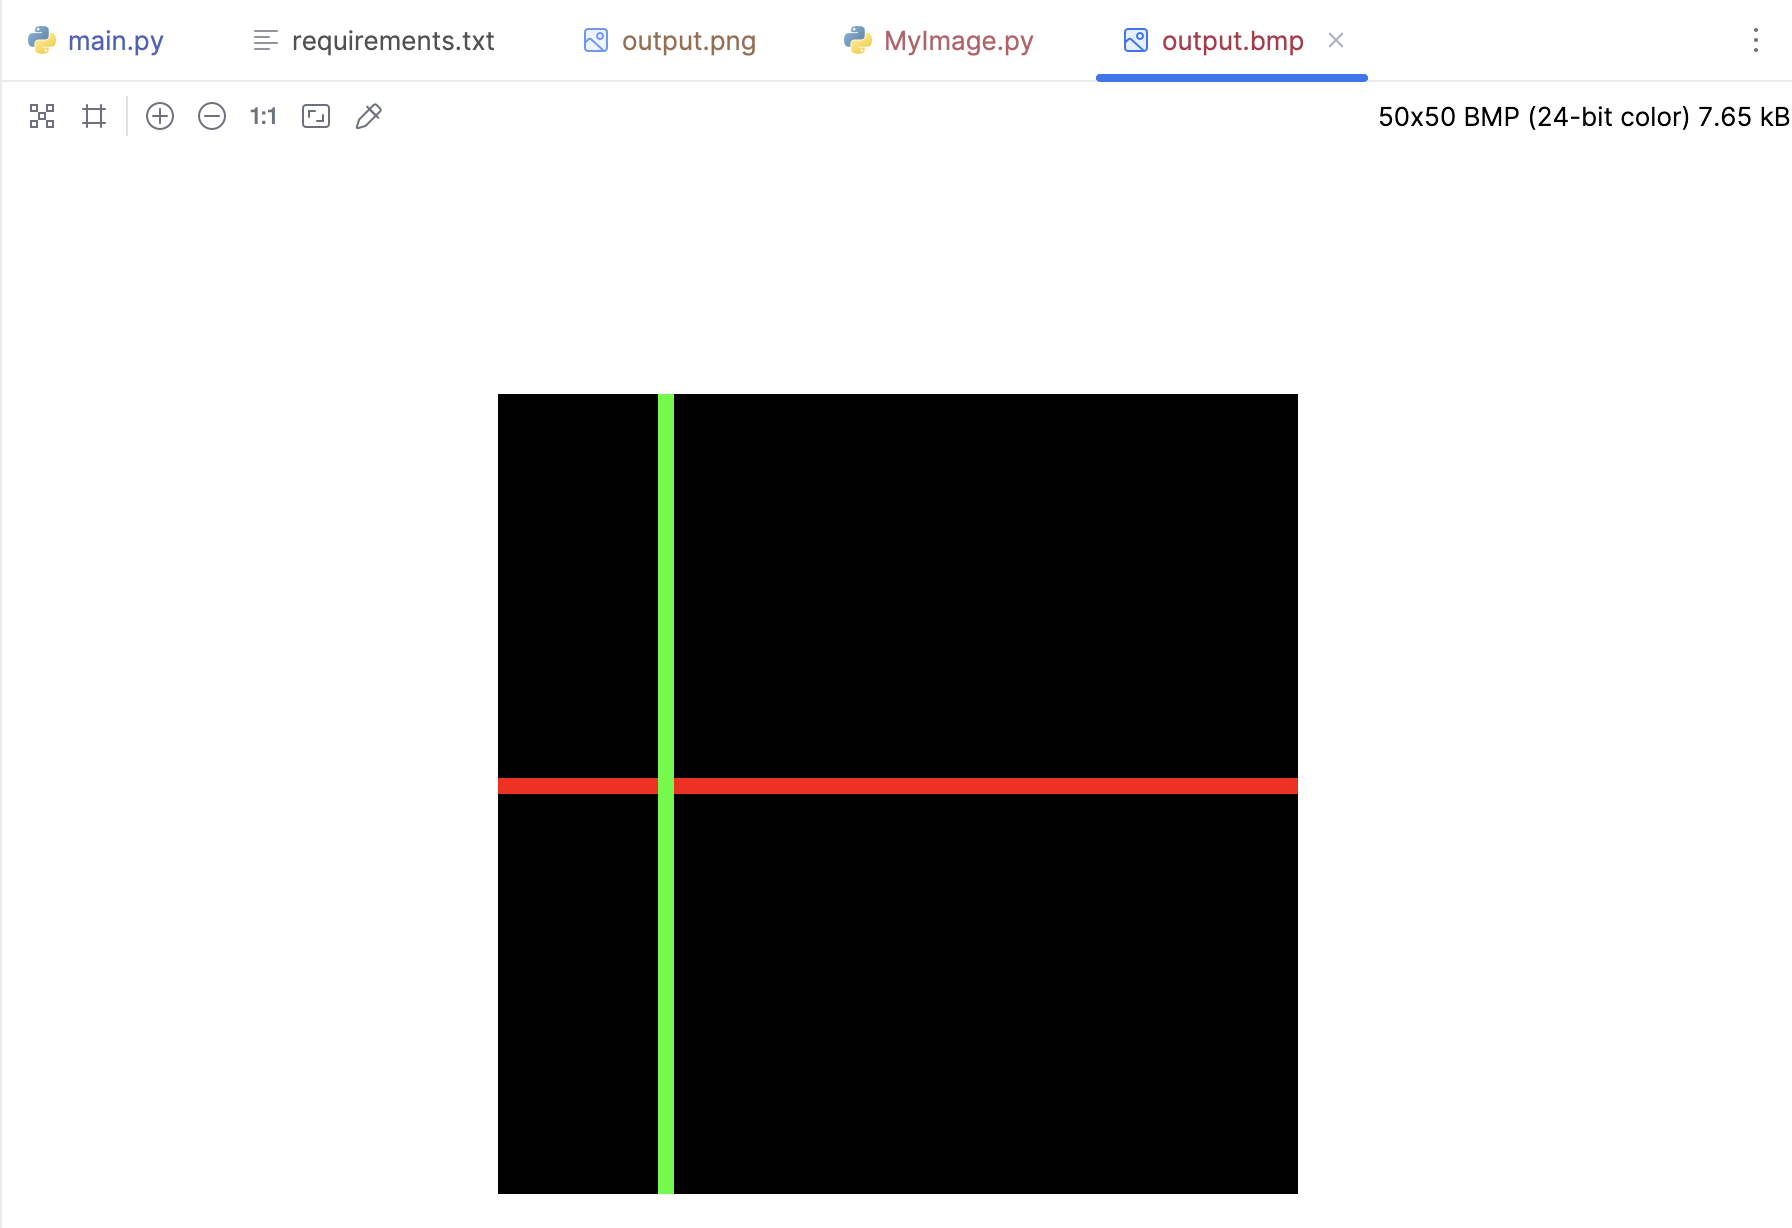
哈哈,不是说不用外部库吗?其实我们也可以自己实现一个简单版本,虽然不是重点,但是如果真的零外部依赖也是可以做到的,下面给出一个实现方案,只不过是最基本的Bitmap样式,最核心的点在于Bitmap的编码,BMP文件格式规定了多字节值应该以little endian格式存储,这就是为什么在代码中使用了'little'参数,因为使用的是小端字节序:
class MyImage:
    def __init__(self, size, color=(0, 0, 0)):
        self.width, self.height = size  # 定义图像的宽度和高度
        self.data = [[color for _ in range(self.width)] for _ in range(self.height)]  # 初始化图像数据

    def putpixel(self, position, color):
        x, y = position  # 获取像素位置
        if 0 <= x < self.width and 0 <= y < self.height:  # 检查像素位置是否在图像范围内
            self.data[y][x] = color  # 设置像素颜色

    def save(self, filename):
        with open(filename, 'wb') as f:
            # BMP文件头(14字节)
            f.write(b'BM')  # ID字段
            f.write((14 + 40 + self.width * self.height * 3).to_bytes(4, 'little'))  # 文件大小
            f.write((0).to_bytes(2, 'little'))  # 未使用
            f.write((0).to_bytes(2, 'little'))  # 未使用
            f.write((14 + 40).to_bytes(4, 'little'))  # 偏移至像素数据

            # DIB头(40字节)
            f.write((40).to_bytes(4, 'little'))  # 头大小
            f.write((self.width).to_bytes(4, 'little'))  # 图像宽度
            f.write((self.height).to_bytes(4, 'little'))  # 图像高度
            f.write((1).to_bytes(2, 'little'))  # 颜色平面数量
            f.write((24).to_bytes(2, 'little'))  # 每像素位数
            f.write((0).to_bytes(4, 'little'))  # 压缩方法
            f.write((self.width * self.height * 3).to_bytes(4, 'little'))  # 图像大小
            f.write((0).to_bytes(4, 'little'))  # 水平分辨率
            f.write((0).to_bytes(4, 'little'))  # 垂直分辨率
            f.write((0).to_bytes(4, 'little'))  # 色彩板中的颜色数量
            f.write((0).to_bytes(4, 'little'))  # 重要颜色数量

            # 像素数据
            for y in range(self.height):
                for x in range(self.width):
                    r, g, b = self.data[y][x]  # 获取像素颜色
                    f.write(b.to_bytes(1, 'little'))  # 蓝色
                    f.write(g.to_bytes(1, 'little'))  # 绿色
                    f.write(r.to_bytes(1, 'little'))  # 红色

                # 填充至4字节
                for _ in range((self.width * 3) % 4):
                    f.write(b'\x00')  # 写入填充字节

image = MyImage((50, 50))  # 创建一个新的图像实例

red = (255, 0, 0)  # 定义红色
green = (0, 255, 0)  # 定义绿色

for i in range(0, 50):
    image.putpixel((i, 25), red)  # 在图像中添加红色像素
    image.putpixel((10, i), green)  # 在图像中添加绿色像素

image.save('output.bmp')  # 保存图像为BMP文件
Vector2、Vector3
在读取obj文件之前,我们还需要一些基础类,比如Vector2,Vector3,以此来定义三维向量的基本结构,添加一些常见的向量操作,如加法、减法、点积(内积)、叉积、长度(模),以及标准化等。另外Vector2二维向量没有叉积操作。
import math


class Vec2:
    def __init__(self, values):
        self.x, self.y = values

    def __add__(self, other):
        return Vec2([self.x + other.x, self.y + other.y])

    def __sub__(self, other):
        return Vec2([self.x - other.x, self.y - other.y])

    def __mul__(self, other):
        if isinstance(other, (int, float)):  # 向量和标量的乘法
            return Vec2([self.x * other, self.y * other])
        elif isinstance(other, Vec2):  # 两个向量的点积
            return self.x * other.x + self.y * other.y

    def __rmul__(self, scalar):
        return self.__mul__(scalar)

    def norm(self):
        return math.sqrt(self.x * self.x + self.y * self.y)

    def normalize(self, l=1):
        norm = self.norm()
        self.x *= l / norm
        self.y *= l / norm
        return self

    def __str__(self):
        return f'({self.x}, {self.y})'


class Vec3:
    def __init__(self, values):
        self.x, self.y, self.z = values

    def __add__(self, other):
        return Vec3([self.x + other.x, self.y + other.y, self.z + other.z])

    def __sub__(self, other):
        return Vec3([self.x - other.x, self.y - other.y, self.z - other.z])

    def __mul__(self, other):
        if isinstance(other, (int, float)):  # 向量和标量的乘法
            return Vec3([self.x * other, self.y * other, self.z * other])
        elif isinstance(other, Vec3):  # 两个向量的点积
            return self.x * other.x + self.y * other.y + self.z * other.z

    def __rmul__(self, scalar):
        return self.__mul__(scalar)

    def cross(self, other):
        return Vec3([self.y * other.z - self.z * other.y,
                     self.z * other.x - self.x * other.z,
                     self.x * other.y - self.y * other.x])

    def norm(self):
        return math.sqrt(self.x * self.x + self.y * self.y + self.z * self.z)

    def normalize(self, l=1):
        norm = self.norm()
        self.x *= l / norm
        self.y *= l / norm
        self.z *= l / norm
        return self

    def __str__(self):
        return f'({self.x}, {self.y}, {self.z})'
实现obj文件的读取
.obj 文件是一种3D模型文件格式,我们需要理解 .obj 文件的格式,才能正确的读取。OBJ文件包含了3D几何形状的面、顶点和纹理映射信息。在OBJ文件中,v、vt、vn和f都是重要的元素,分别代表了顶点、纹理坐标、法向量和面。
v:这是一个顶点的几何位置。它是一个三维坐标,表示为(x, y, z)。例如,v 1.000 1.000 0.000表示一个位于(1,1,0)的顶点。
vt:这是一个纹理坐标。它通常是一个二维坐标,表示为(u, v),用于映射3D模型的表面纹理。例如,vt 0.500 1.000表示一个纹理坐标位于(0.5,1)。
vn:这是一个顶点的法向量。它是一个三维向量,表示为(x, y, z),用于计算光照和阴影效果。例如,vn 0.000 0.000 1.000表示一个指向Z轴正方向的法向量。
f:这是一个面,由三个或更多的顶点定义。面的定义通常包含顶点、纹理坐标和法向量的索引。例如,f 1/1/1 2/2/2 3/3/3表示一个由第1、2、3个顶点、纹理坐标和法向量定义的三角形面。
在OBJ文件中,这些元素的索引是从1开始的,而不是从0开始。这意味着f 1/1/1 2/2/2 3/3/3中的1、2、3实际上是指向第一个、第二个和第三个顶点、纹理坐标和法向量,而不是第0个、第1个和第2个。
由于目前我们只需要顶点和面的信息,所以先构造一个简单的读取obj文件的工具类对象:
class OBJFile:
    def __init__(self, filename):
        self.filename = filename
        self.vertices = []
        self.faces = []

    def parse(self):
        with open(self.filename, 'r') as file:
            for line in file:
                components = line.strip().split()
                if len(components) > 0:
                    if components[0] == 'v':
                        self.vertices.append([float(coord) for coord in components[1:]])
                    elif components[0] == 'f':
                        self.faces.append([int(index.split('/')[0]) for index in components[1:]])

    def vert(self, i):
        """
        :param i: vertex index
        :param i: 因为obj文件的顶点索引是从1开始的,所以需要减1
        :return:
        """
        return Vec3(self.vertices[i - 1])
Bresenham线段绘制算法
上面的例子中展示了如何绘制直线,但是都是横竖的直线,现在来看看斜线怎么绘制。其实在之前的博客中:《直线光栅化DDA、Brensenham算法与三角形光栅化》,简单介绍过直线的绘制算法,这里再稍微复习复习Bresenham的线段算法。该算法是一个基于整数运算的高效线段绘制算法。
首先,定义函数line,它接受两个点的坐标(x0, y0)和(x1, y1),一个图像对象image,和一个颜色color作为参数。
def line(x0, y0, x1, y1, image, color):
    steep = False
    if abs(x0 - x1) < abs(y0 - y1):  # 如果线段很陡,我们转置图像
        x0, y0 = y0, x0
        x1, y1 = y1, x1
        steep = True
    if x0 > x1:  # 确保线段是从左往右绘制
        x0, x1 = x1, x0
        y0, y1 = y1, y0

    dx = abs(x1 - x0)
    dy = abs(y1 - y0)
    slope = 2 * dy
    step = 0

    y = y0

    y_incr = 1 if y1 > y0 else -1
    if steep:
        for x in range(x0, x1 + 1):
            image.putpixel((y, x), color)
            step += slope
            if step > dx:
                y += y_incr
                step -= 2 * dx
    else:
        for x in range(x0, x1 + 1):
            image.putpixel((x, y), color)
            step += slope
            if step > dx:
                y += y_incr
                step -= 2 * dx
简单解释一下这段代码:
定义一个布尔变量steep,用来表示线段的斜率是否大于1(是否陡峭)。如果线段的y方向的距离大于x方向的距离,那么就把线段进行转置,这是为了确保我们能正确地在任意斜率的情况下绘制线段。
steep = False
if abs(x0 - x1) < abs(y0 - y1):  # 如果线段很陡,我们转置图像
    x0, y0 = y0, x0
    x1, y1 = y1, x1
    steep = True
接下来,如果线段是从右向左绘制的,我们交换两个端点的坐标,使得线段总是从左向右绘制。这是为了简化后面的循环逻辑。
if x0 > x1:  # 确保线段是从左往右绘制
    x0, x1 = x1, x0
    y0, y1 = y1, y0
然后,我们计算出线段在x方向和y方向的距离,以及线段的斜率(乘以2,这是为了避免使用浮点数运算)。
dx = abs(x1 - x0)
dy = abs(y1 - y0)
slope = 2 * dy
初始化一个变量step,用来在后面的循环中累积误差。
step = 0
确定y方向的增量,如果y1大于y0,那么y_incr为1,否则为-1。
y = y0
y_incr = 1 if y1 > y0 else -1
接下来,根据steep的值,选择不同的绘制方法。如果steep为True,那么我们在y方向上递增x,并在x方向上递增y。否则,我们在x方向上递增x,并在y方向上递增y。
if steep:
    for x in range(x0, x1 + 1):
        image.putpixel((y, x), color)
        step += slope
        if step > dx:
            y += y_incr
            step -= 2 * dx
else:
    for x in range(x0, x1 + 1):
        image.putpixel((x, y), color)
        step += slope
        if step > dx:
            y += y_incr
            step -= 2 * dx
在每次循环中,我们都会在当前的位置上画一个点,然后增加step的值。如果step大于dx,那么我们就在y方向上递增(或递减)一步,并把step减去2*dx。这个过程就是Bresenham的线段算法的核心,它能够在整数运算的基础上准确地模拟出线段的形状。
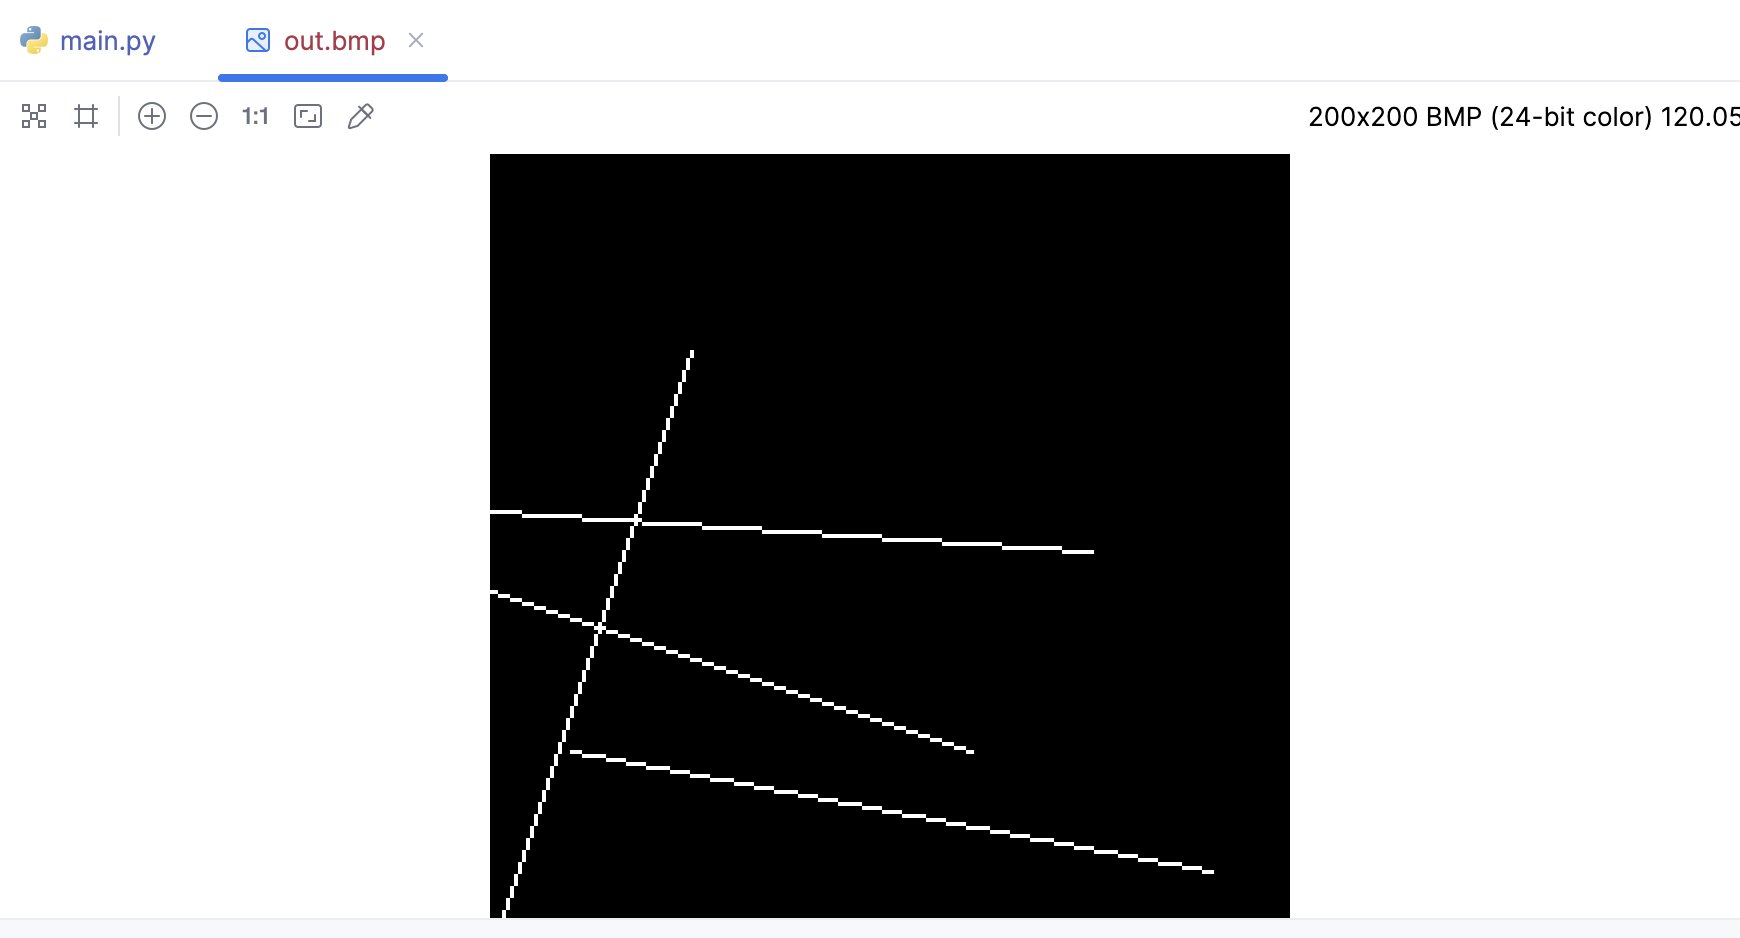
现在我们尝试下这个方法:
if __name__ == '__main__':
    width = 200
    height = 200
    image = MyImage((width, height))
    white = (255, 255, 255)
    line(0, 0, 50, 150, image, white)
    line(0, 90, 120, 50, image, white)
    line(150, 100, 0, 110, image, white)
    line(180, 20, 20, 50, image, white)
    image.save('out.bmp')
通过绘制线段展示模型
我们这里仅仅是展示模型的网格,通过绘制线段的方式展示出来就OK,所以仅仅知道顶点和面的信息即可。其中需要将模型的将3D坐标转换为宽高设定值的Image内的2D像素坐标,这样才能保证模型展示是居中的。
if __name__ == '__main__':
    width = 800
    height = 800
    image = MyImage((width, height))
    white = (255, 255, 255)
    obj = OBJFile('african_head.obj')
    obj.parse()

    for face in obj.faces:
        for j in range(3):
            v0: Vec3 = obj.vert(face[j])
            v1: Vec3 = obj.vert(face[(j + 1) % 3])
            x0 = int((v0.x + 1) * width / 2)
            y0 = int((v0.y + 1) * height / 2)
            x1 = int((v1.x + 1) * width / 2)
            y1 = int((v1.y + 1) * height / 2)
            line(x0, y0, x1, y1, image, white)
    image.save('out.bmp')
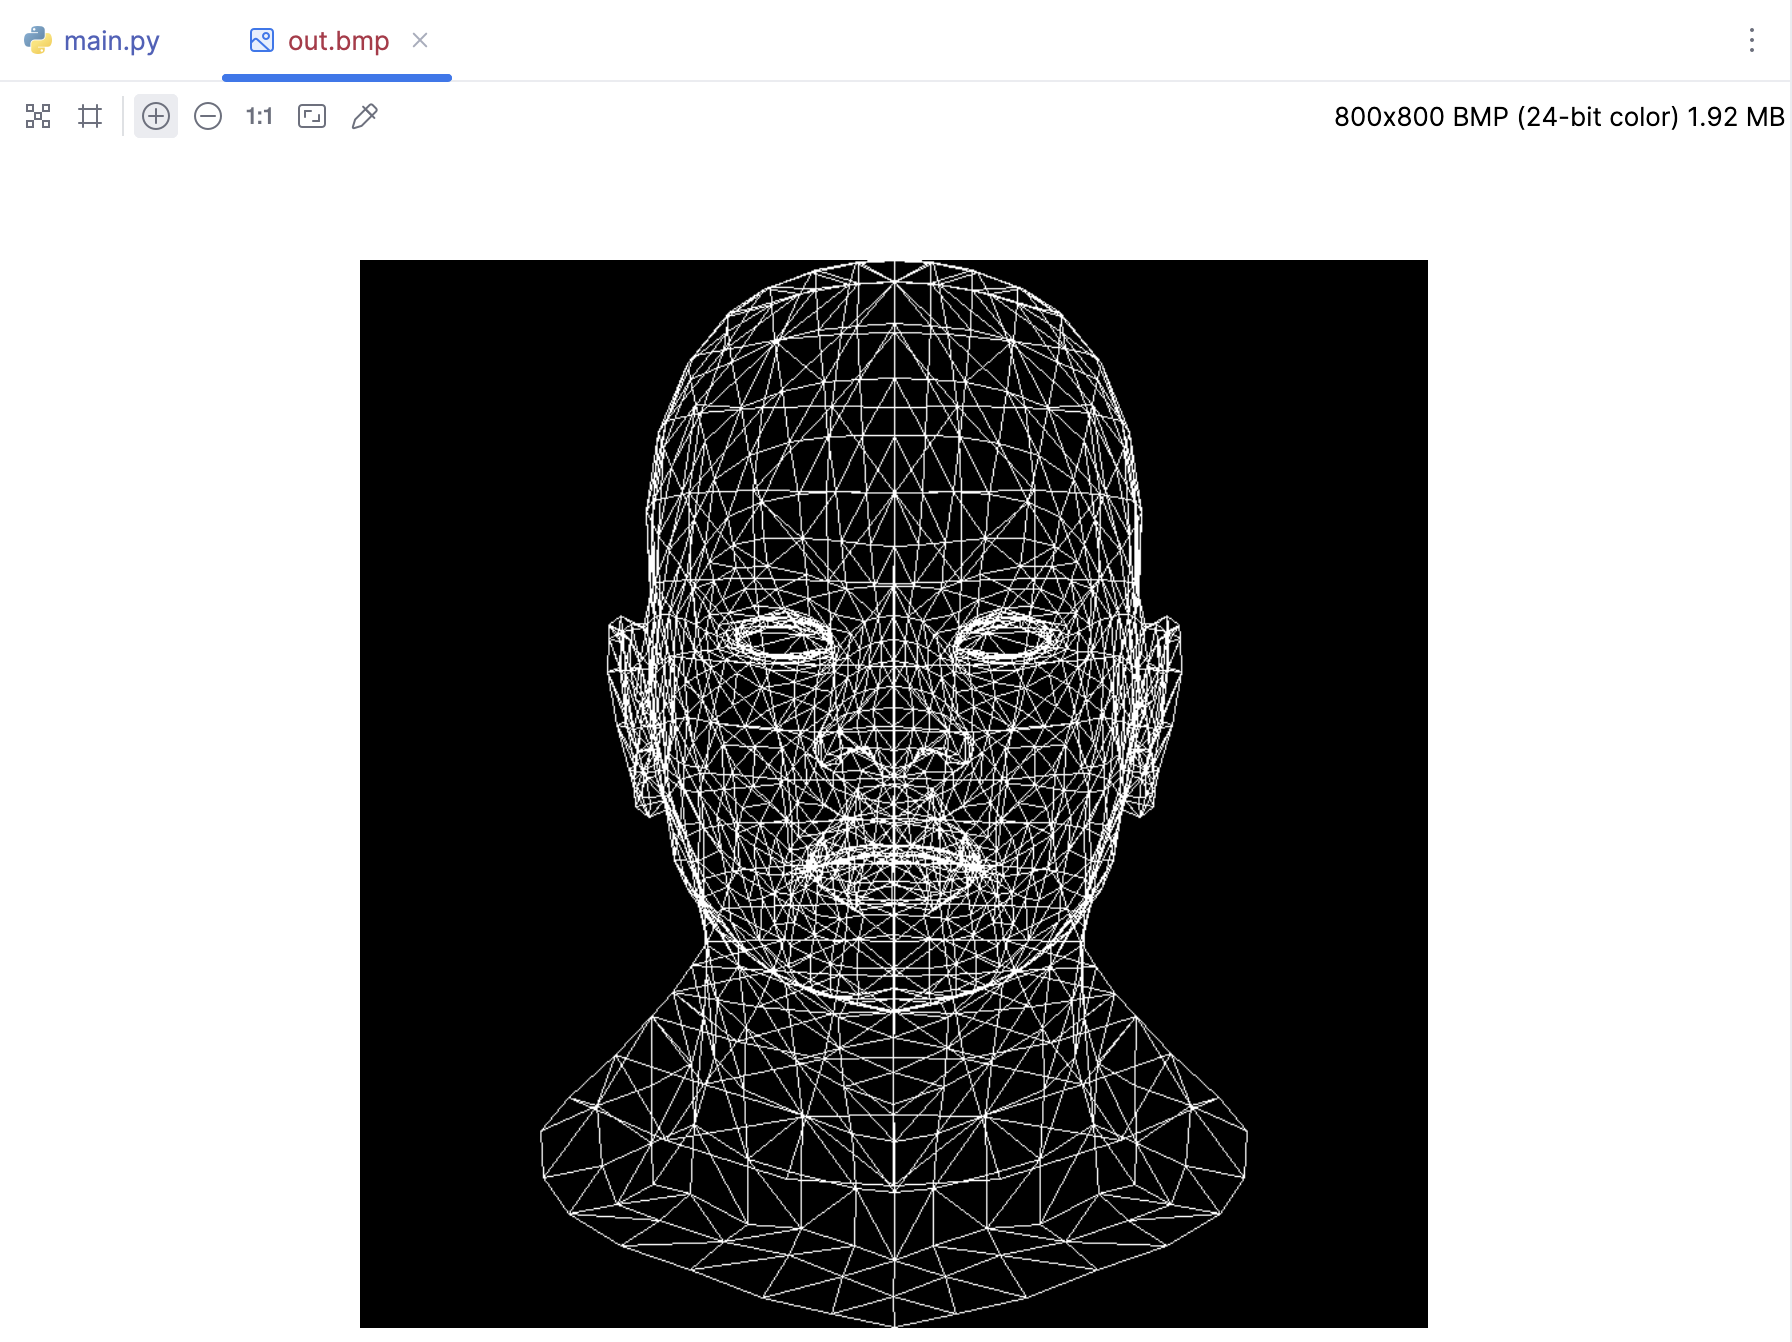
本文是关于如何用Python制作一个简化版的3D渲染器,展示了如何自己编写代码来生成简单的Bitmap图片,这样就不需要依赖任何外部库了,介绍了两个重要的类,Vector2和Vector3,这两个类用于处理2D和3D向量的计算,包括加法、减法、点积、叉积、长度和标准化等操作。然后记录了如何读取.obj文件、如何使用Bresenham线段绘制算法来在屏幕上绘制3D模型。
本节就先这样,代码我放在这里了: https://github.com/zouchanglin/PyTinyRenderer